Dashboard for the optimizer - a convenient board with the necessary reports

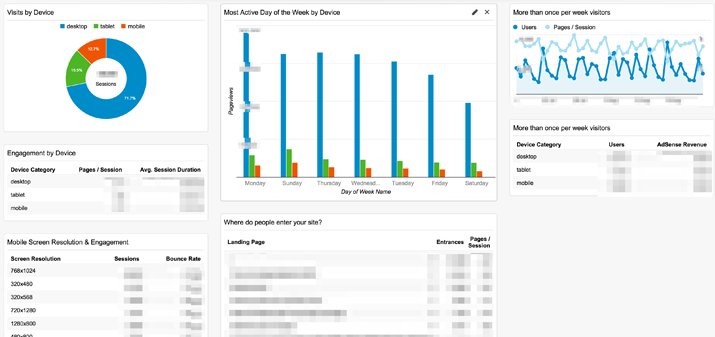
The work of an SEO specialist certainly includes a set of all kinds of reports, tools and services that he uses on a daily basis. Viewing each report individually takes a long time. It is more convenient to use pivot tables or dashboards, where all the necessary reports are included at once, and you can see the picture of the site as a whole. Dashboard from Google Analytics may well become such a tool. It will show both a general report and a detailed picture for each widget.
Necessary data for the daily work of a promotion specialist
 share of organic matter. In order to adequately evaluate traffic, you need to see the share of organic traffic from the total.
organic dynamics. Any figures in the reports must be viewed in dynamics. This will provide an opportunity to assess the progress of the advertising campaign, as well as see the ups and downs of traffic.
Main characteristics. They display a general picture of the user's behavior on the site and the relevance of the content offered to them. The main indicators are bounces, average number of pages per visit, behavior on the web page, average time spent, number of unique users.
Popular keywords. When analyzing popular keywords, don't forget to exclude non set, branded traffic, and not provited from the report. They are not informative for promotion. Seeing statistics on keywords, you can (and even need to) update and expand the semantics of the site.
traffic sources. If your site is promoted in several search engines, it is important to monitor the popularity and indicators of sources: the share of traffic generated by search engines, micro conversions, e-commerce conversion rate.
Remember that advertising in Yandex.Direct must have UTM tags, otherwise all traffic will merge into organic traffic, thereby noisy the channel. For more accurate results, use segment filters (exclude URLs containing yclid and openstat).
Geography of incoming traffic. If the site is being promoted in a particular region, it is worth remembering about possible traffic from other cities. If one is tracked, there are problems in the ranking settings.
Landing pages. The report on such pages displays the impact of search promotion on the ranking of the resource. Here you can immediately see which pages receive more traffic, which less, as well as the conversion rate of such pages. The indicators in the report can be used to evaluate the effectiveness of traffic. So, for example, when conducting an audit of an online store, it is important to determine the impact of the attendance of the section itself on the attendance of product cards. If the result is not satisfactory, make the necessary changes.
Creating dashboard widgets
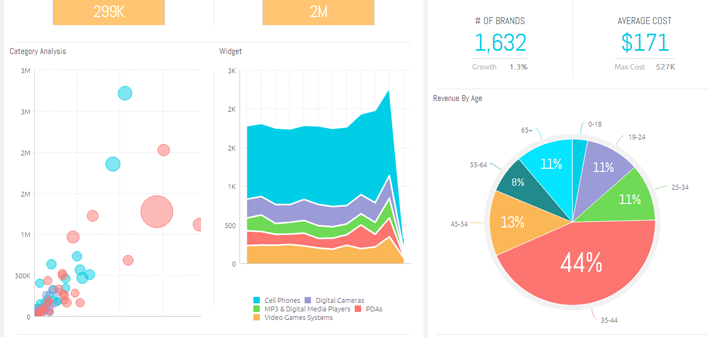 The advantage of a dashboard is the presence of widgets of reports that are important to you.
Step 1. Select a pie chart to display total traffic data. It will show a clear picture - the share of a particular channel against the background of total traffic. Take visits as a metric. Want to drill down into the report by channel? Add a link to it.
Step 2. Create a widget that will show the movement of search traffic. "Widget type" select Timeline. In "Metrics" - the number of visits. "Additional metrics" - select the bounce rate. Now it will be possible to track user behavior depending on the fall or rise in traffic, month, days of the week, etc. Remember that the filter is needed only for search traffic. It is also important to add a link to the detailed report in Analytics.
Step 3. Create 4 numeric widgets (type - metric) for the following indicators:
- Conversion rate
- Bounce rate
- Pages/visit
- Average visit duration
All widgets are created according to the same principle, only the metrics change. The filter also remains unchanged.
Now let's start creating Table - table widgets. 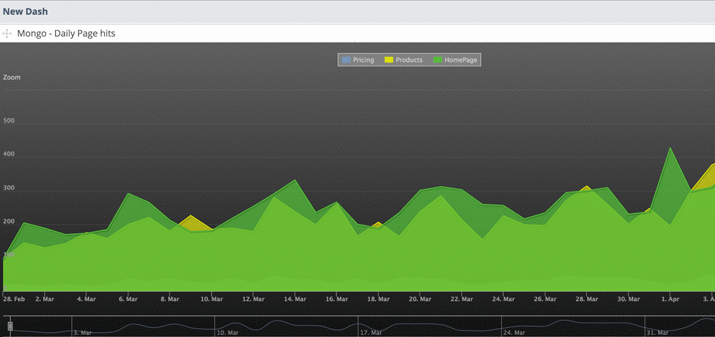
As metrics for the widget, we select profitability and sessions (if it is for an online store, we select the conversion rate). Add these filters:
- By keywords
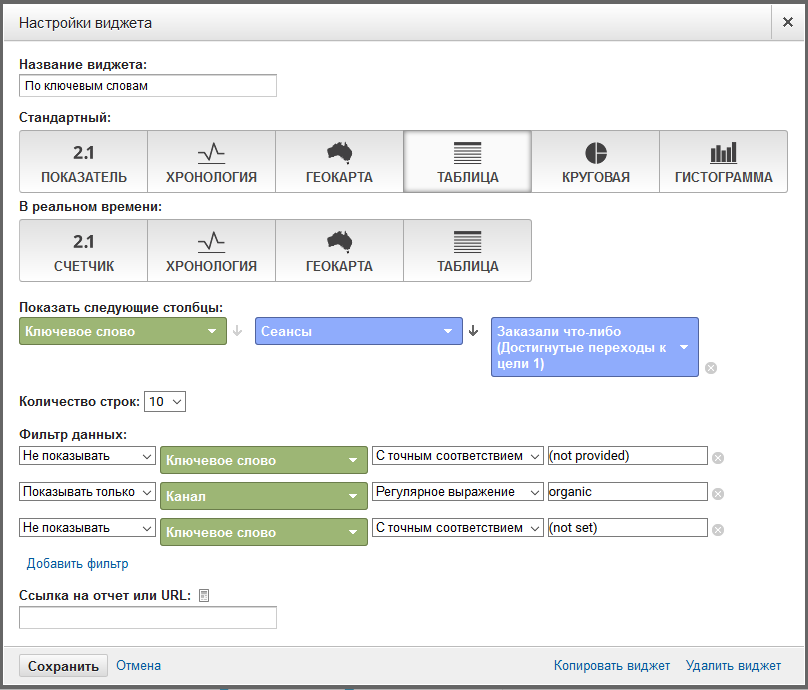
- To display only search traffic.
- We exclude phrases that contain branded traffic, not provided and not set.
Do not forget about the link to the detailed report. To display the report, we leave 10 lines - the maximum allowable number.
- According to sources
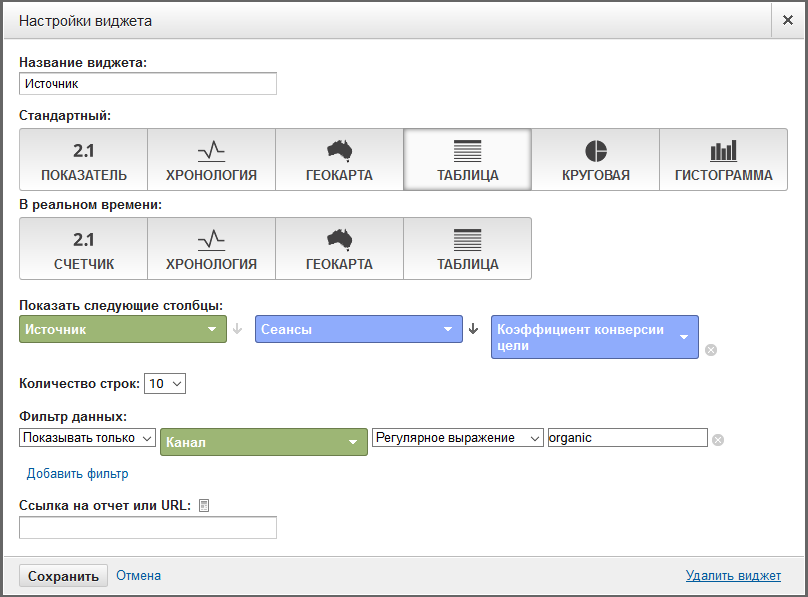
This widget is based on the previous one. It is only necessary to replace "keywords" with "sources", cancel the filter on them, and replace the link to a detailed report. 5 lines are enough to display the report.
- Geography of visits
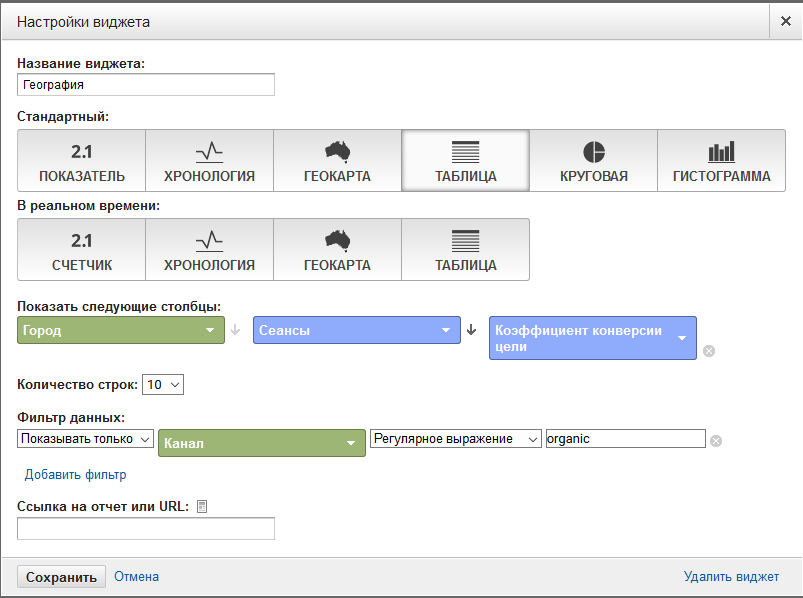
Also similar to the previous one. Copy the previous widget. Replace only "Sources" with "City visited" and, of course, a link to a detailed report.
By landing pages
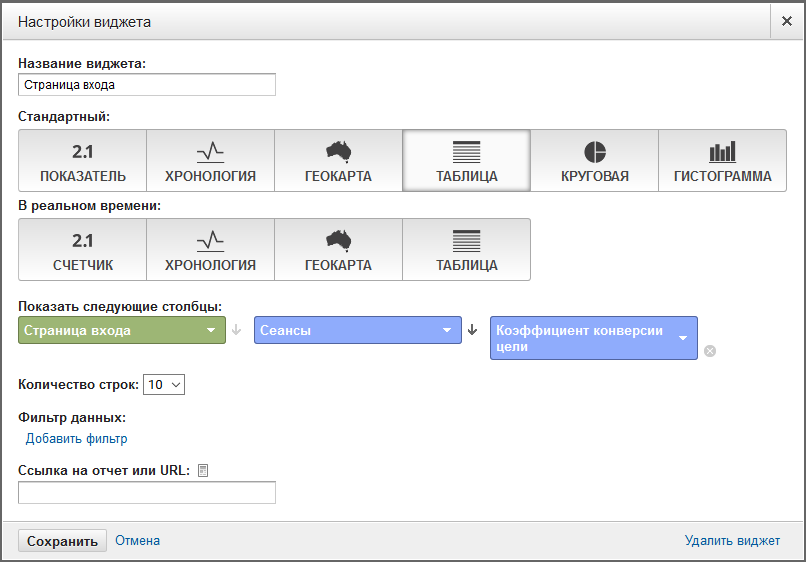 Copy the previous table. In the parameter, select "Landing pages", leave 10 lines to display the report, replace the link with the corresponding report.
The report will be visual if you analyze the indicators in the current time mode with the indicators of the previous month.