Google Analytics: we use it to the fullest!

 Do you want the site to bring good profit? Then it is worth increasing the efficiency of the site. This is what web analytics is for. And with the help of the Google Analytics resource, you can quickly get the data you need, you just have to put our simple tips into practice.
Correct settings
 First, the tracking code is set, and then simple operations are performed:
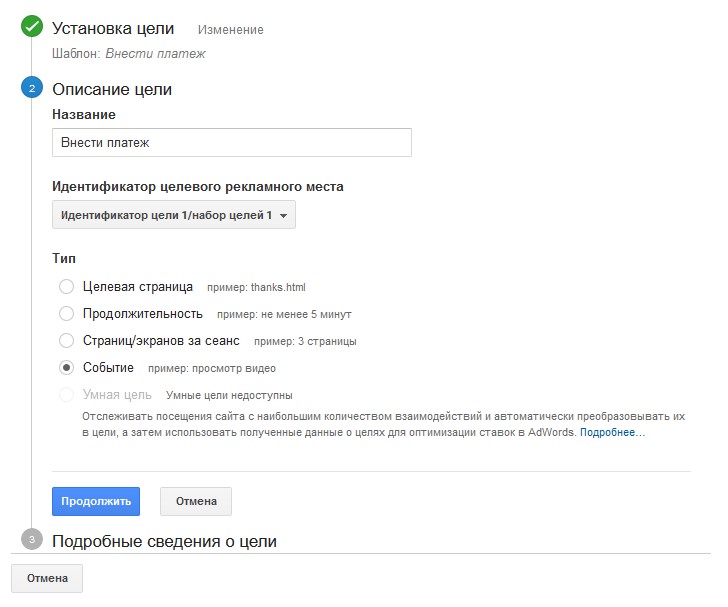
- Set up goals. With the help of goals, they track the main performance metric - traffic conversion. Targets are selected in accordance with the ongoing marketing campaign. As a rule, they are divided into categories according to their importance. So, macro goals include placing and paying for an order, clicks on ads, and micro tasks - subscribing to a newsletter or familiarizing yourself with the "information about the company" page. The new target is configured in the "Administrator" menu. Here you can choose a template or make all the settings yourself. You can also specify all the details about the goal, including its value. After the settings are completed, they should be saved.
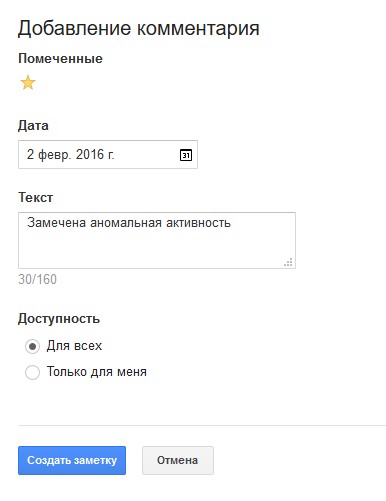
- Annotations are enabled. Web analytics will help in decision making, but to do this, ask the right questions - why and how? But "what happened?" will not help in solving the problem. After all, this excludes analysis. Therefore, the correct wording when reducing traffic is “how did it happen”, and not “what happened”. An annotation can be created according to a certain algorithm: select a report and go to the menu for creating a comment. After that, you choose a date and define an access policy, and then write an annotation (less than 160 characters).
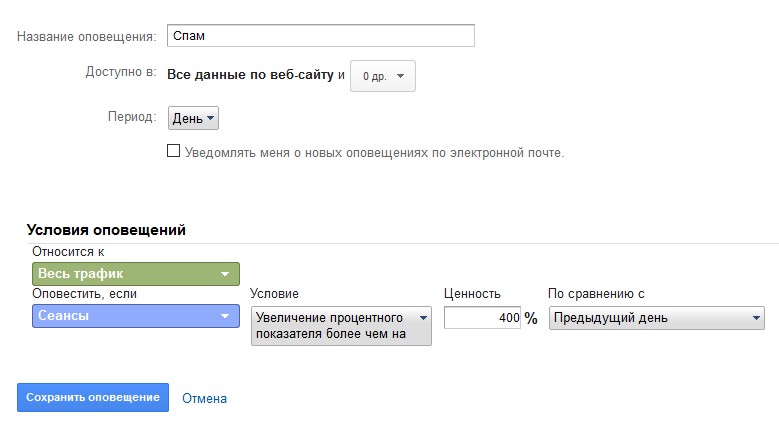
- Keep track of events thanks to the "Alerts" menu. You can create them in the corresponding tab "my alerts": the control menu is new. Here you should indicate: the condition, name, timing and expediency of sending new notifications to E-mail.
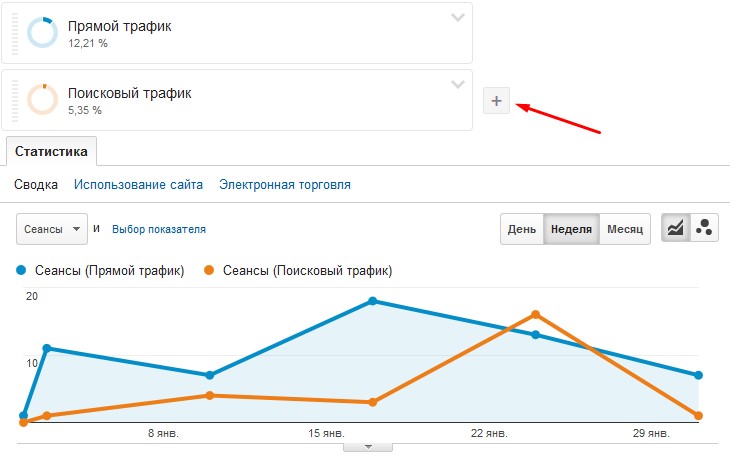
- Set up custom segments. They are needed for a detailed analysis - to determine from which devices / browsers most often access the resource. The custom segment is added as "add report". You can create a segment or use a template. For self-configuration, use the “+ Segment” column, all the necessary information is not indicated, and then the information is saved.
How to track the effectiveness of marketing
 Google Analytics is used to track the effectiveness of marketing campaigns.
Use UTM tags. They allow you to track the effectiveness of marketing by 5 parameters - sources of content and products, transitions and channels and requests. The performance of ads, links to external resources, banners - all this is tracked by tags.
You can add them in the Google builder.
For Google Spreadsheets, also install Google Analytics, which will automatically fill in all the interesting information in the spreadsheet. The creation algorithm consists of the following operations: Add-ons - Google Analytics - Create new report - name the report - select an account - name the tracked metrics - save.
To prepare a report, use the Run reports function, and for periodic updates, use Schedule reports. Reports can be created from a template, or you can use your own custom reports. To do this, a report is added for certain groups, then it is saved and a label is selected for it.
To track performance, summaries are also used - standard or custom. More often choose ready-made solutions.
What else can Google Analytics do?
 Additional features are aimed at making the work convenient. For example, if you hide the vertical menu, the reports expand to fit the width of the screen. In this display format, it is convenient to prepare slides / illustrations.
By clicking on "?", you can see the list of hot buttons.
And if you click a link in the horizontal menu, you can add shortcuts to the vertical menu for quick access to the information you need.
Using the search module on the top left, you can quickly find the summary you need. And if you put the cursor in the search field, the system will show those reports that have been recently used.
At the top right is an icon that displays animated graphics.
And do not forget the main rule of using Google Analytics - before you open the system, determine what kind of statistics you want to receive. Then it will be easier for you to figure out how to use the information received to increase business efficiency and find which channels require additional elaboration.