How the demand for goods on the Internet depends on the season

A business can be present on the Internet as a group in social networks or as a full-fledged corporate website . A company of any format makes plans to “capture the network” and plans to increase profits from the very first days of the resource placement. But in most cases, these plans are not destined to come true 100%. After all, very often when planning they forget about the seasonality of demand for goods and services.
The seasonality of demand in the network is determined by the change in the number of search phrases, queries and intents - the needs that the user wants to satisfy when searching for a query. So, the beginning of spring provokes a demand for seeds and seedlings, and autumn - for umbrellas and raincoats. This is the simplest example of how the needs of potential customers change with the seasons of the year.
What data sources to use for demand analysis
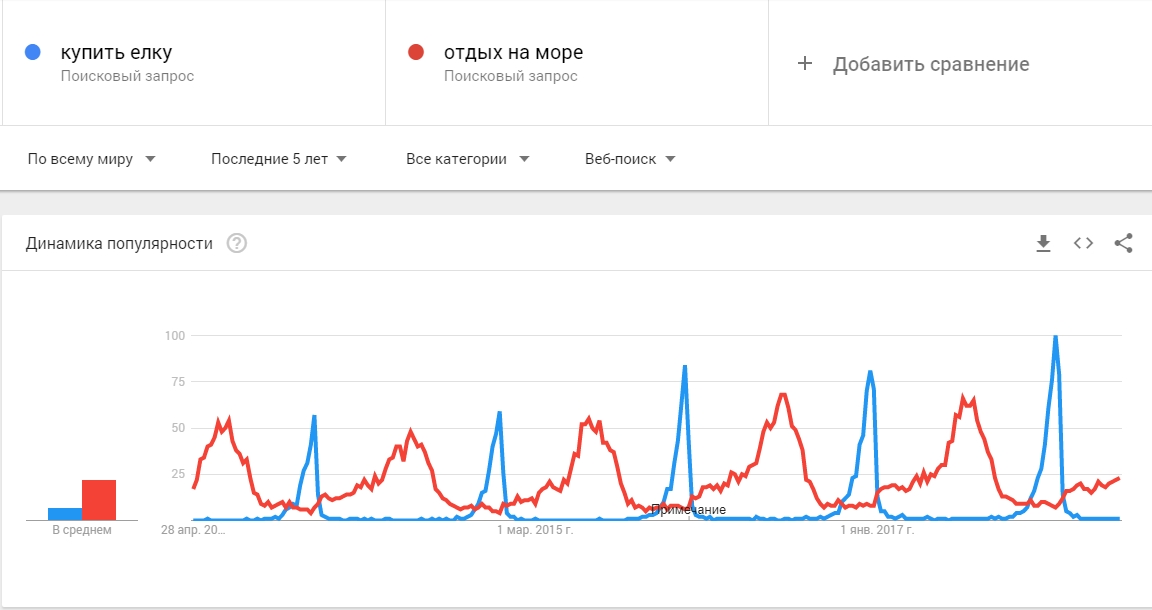
There are two popular and affordable services that help estimate demand depending on the season. The first is Google Trends, which analyzes search engine statistics. The service provides the following data:
- change in demand in dynamics, presented visually;
- the possibility of sampling statistics by region;
- clarification of the subject of the request;
- clarification of the service to which the request is made: it can be YouTube, search results or news;
- search and demonstration of similar offers;
- comparison of different thematic products and a clear demonstration of demand in dynamics.
But interest in the request is shown only approximately, and there may not be any results for specific cities.
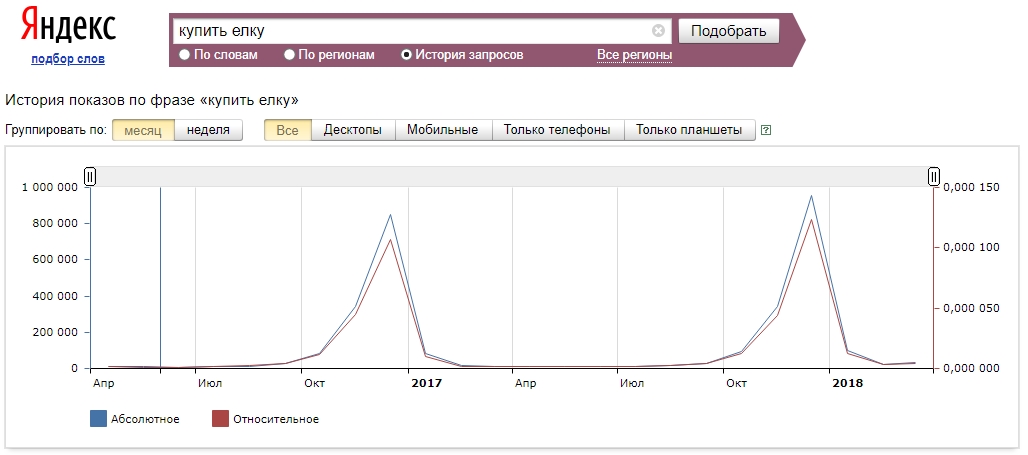
The second service is Yandex.Wordstat. It provides the following information on demand:
- frequency of search queries in the last month;
- used "tails" to queries that are used by users to refine the query;
- statistics on the devices used (that is, you can evaluate whether your users search for your products most often from smartphones, tablets or desktops);
- georeferenced statistics.
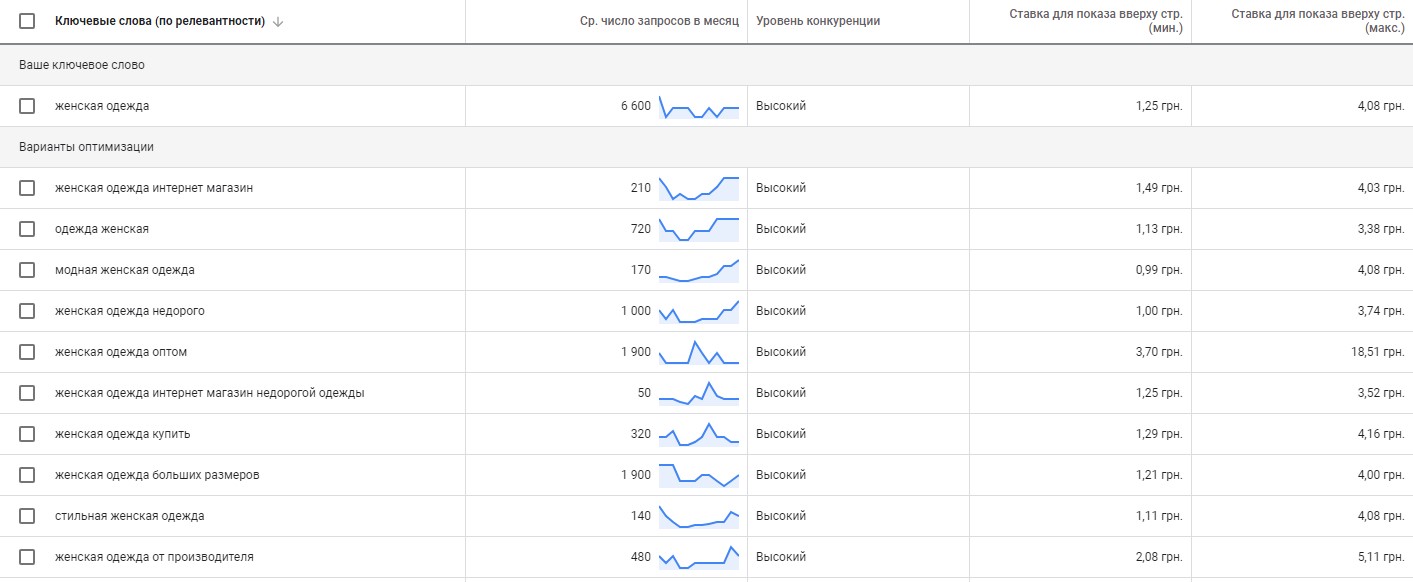
The third service is AdWords Keyword Planner. This service is unrivaled, but it only provides accurate data for those advertised on Google AdWords.
Thus, you can track the history of queries, as well as issuance by words and regions.
In order to present the information obtained visually, you will need to draw up a report. Each product or service will need its own line. Then the URL of the page, the control phrase for which reporting is collected, and the months with maximum and minimum activity are marked.
How to work with the seasonality map
Here is the sequence in which to fill in the information in the prepared table in order to get complete information:
- primary data. This is the product type, page address and place in the site directory structure. There are programs that help to parse the necessary data, but you can also make a selection manually. First, fill in the type of product, for example, "women's office dresses." Then we indicate the address of the site page, and after that - the location in the structure, for example, "shop - women's clothing - dresses - office".
- Selection of key (control) phrases. The issue is viewed in Yandex.Wordstat for a specific region. In this case, you can evaluate all the additional keys and different search phrases that users use. You should evaluate all the popular products and services that the company promotes in a particular region. And for each region, the control phrase will be the most frequent. Based on the results, two more columns of the pivot table are filled. These are the "passphrase" and "query frequency".
- Uploading data by month. Yandex.Wordstat has a “Query History” tab, which shows the absolute frequency of keywords on a monthly basis. For each control phrase, you will need to complete columns for 12 months or 2 years, depending on how complete statistics you need.
- Immediately after that, you can add a sparkline to the general table, that is, a mini-graph that clearly demonstrates demand fluctuations by months. To do this, Google Sheets has a special formula “=SPARKLINE ()”. From all the data, the months with the maximum and minimum frequency are found.
How to use the received data
Seasonal information needs to be analyzed, to see when the goods were in maximum demand last year, and based on this, make plans for the current period. You can also use the information obtained to prioritize promotion and catalog filling for new stores in order to predict attendance and profit for the future period. You will also be able to properly plan and conduct promotions at the peak of maximum demand. After all, now the assumptions will be backed up by real numbers.